
Help page
-
Table of Contents
- Annotation
- User Guid
SPM
SPM is a statistical parameter introduced as a sensitive indicator in quantitative estimation of gene expression patterns.Each gene expression profile of gene x is transformed into a vector Xp
where n is the number of samples in the profile and xiis the gene expression level in sample i. For each element in the profile X, the expression xican also be represented by a vector Xi in high dimension feature space:

The SPM of a gene in a sample was then determined by calculating the cosine value of intersection angle Θ between vector Xi and Xp in high dimension feature space:
Theoretically, the SPM ranges from 0 to 1.0. A value close to 1.0 indicates that element xi is the major contributor to the length of profile Xp in high dimension feature space; in biological term, high sample specificity.
where n is the number of samples in the profile and xiis the gene expression level in sample i. For each element in the profile X, the expression xican also be represented by a vector Xi in high dimension feature space:
The SPM of a gene in a sample was then determined by calculating the cosine value of intersection angle Θ between vector Xi and Xp in high dimension feature space:
Theoretically, the SPM ranges from 0 to 1.0. A value close to 1.0 indicates that element xi is the major contributor to the length of profile Xp in high dimension feature space; in biological term, high sample specificity.
ri
ri is a parameter to measure fractional gene expression in a definite sample i against the whole gene expression profile. The ri was calculated by:

SUM
SUM is the sum of fractional expressions in selective samples. The SUM was calculated by:

CTM
The Contribution Measure (CTM) is a parameter developed to help identification of selective genes. The CTM was calculated by:
 where k is the number of selective samples.
Theoretically, the CTM ranges from 0 to 1.0. In biology, a CTM value close to 1.0 suggests gene expressions are enriched in selective samples (normally 2 < SampleNum(k) < 4) comparing to that in other samples.
where k is the number of selective samples.Theoretically, the CTM ranges from 0 to 1.0. In biology, a CTM value close to 1.0 suggests gene expressions are enriched in selective samples (normally 2 < SampleNum(k) < 4) comparing to that in other samples.
DPM
The DPM, in principle, is to map the standard deviation of a gene expression profile into a region of 0 to 1.0. The gene expression profile (Xp) is first converted to its corresponding SPM profile (XSPM):

Then, the DPM is determined by:
Theoretically, the DPM ranges from 0 to 1.0. In biology, a DPM value close to 0 suggests that gene evenly expresses in all samples of a gene expression profile.
Then, the DPM is determined by:
Theoretically, the DPM ranges from 0 to 1.0. In biology, a DPM value close to 0 suggests that gene evenly expresses in all samples of a gene expression profile.
RPM
The Repression Measure (RPM) is a parameter for identification of repressed genes.The gene expression profile in multiple samples were roughly divided into two groups according to their expression levels: the putative repressed expressions and the expressions. Then the RPM was calculated by:
where the "SPMrep_max" stands for the maximum SPM value in the putative repressed expression group and "SPMexp_min" stands for minimun SPM value in the expression group, and k is the number of repressed samples.
Theoretically, the RPM ranges from 0 to 1.0. A RPM value close to 0 indicates high degree of difference between repression group and expression group.
Specific Genes
Genes that specifically express in only one sample. Noramlly, specific gene has a high SPM value, e.g. SPM > 0.9.
Selective Genes
The selective genes are a group of genes whose expressions are enriched in only several conditions (samples). Normally, gene expressions are enriched in limited (e.g. 2 < SampleNum(k) < 4) samples (e.g. CTM > 0.9), and expressions in each of the selective samples are comparatively high (e.g. SPMi > 0.3).
Housekeeping Genes
Housekeeping genes are generally defined as genes that express ubiquitously in all conditions. In strict sense, housekeeping genes evenly express in all samples (e.g. DPM < 0.3).
Repressed Genes
Genes are expressed in almost all conditions except in one or several conditions. Normally, gene expressions are repressed in limited (e.g. 1 < SampleNum(k) < 4) samples (e.g. SPM < 0.1 and RPM< 0.2).
Basic Search
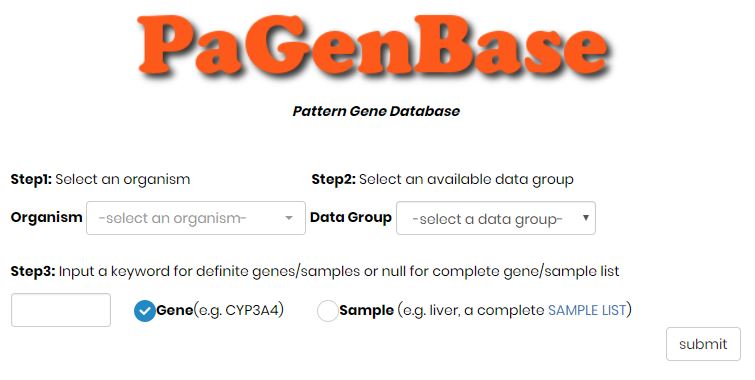


Step 1: select an organism (e.g. Homo sapiens) and data group (e.g. tissue);
Step 2: select a pattern class option (e.g. specific genes);
Step 3: select a textfield option, sample (e.g. liver) or gene (CYP3A4), and input a keyword (please refer to the STATISTICS page for sample lists);
Step 4: click the submit button to initiate search.
The genes or samples that match the query criteria will be responded in alphabet order. Click on a gene symbol or sample name to continue.Clicking on the gene symbol will lead to the detailed information page.
Pattern Genes are listed.
Clicking on the gene symbol will lead to the detailed information page.
Clicking on the gene symbol will lead to the detailed information page.
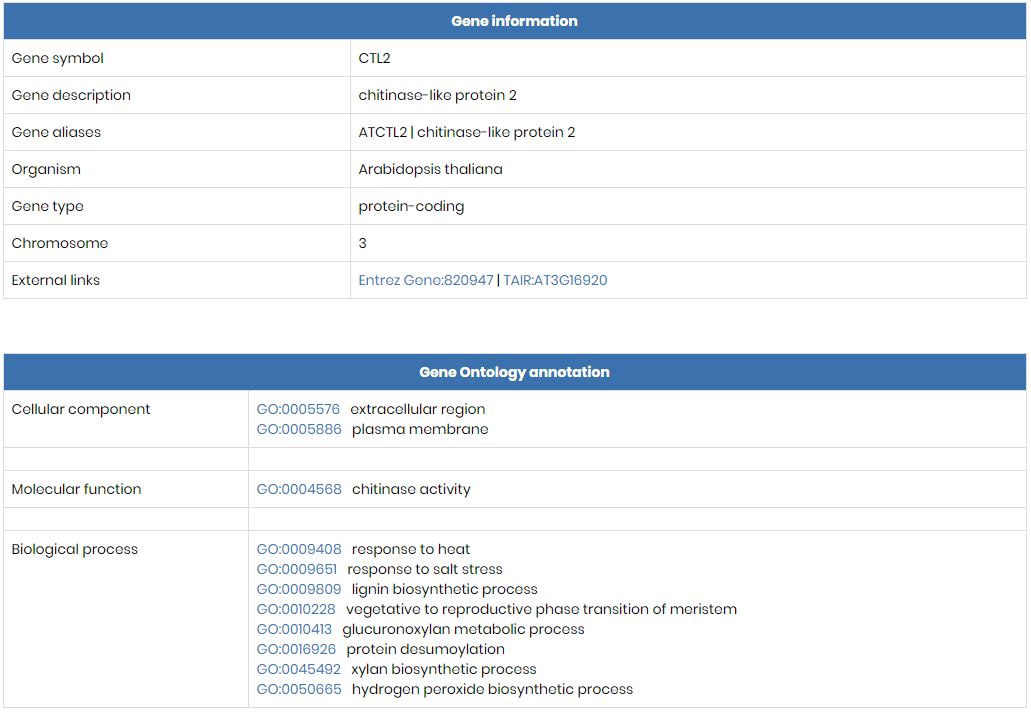
gene information
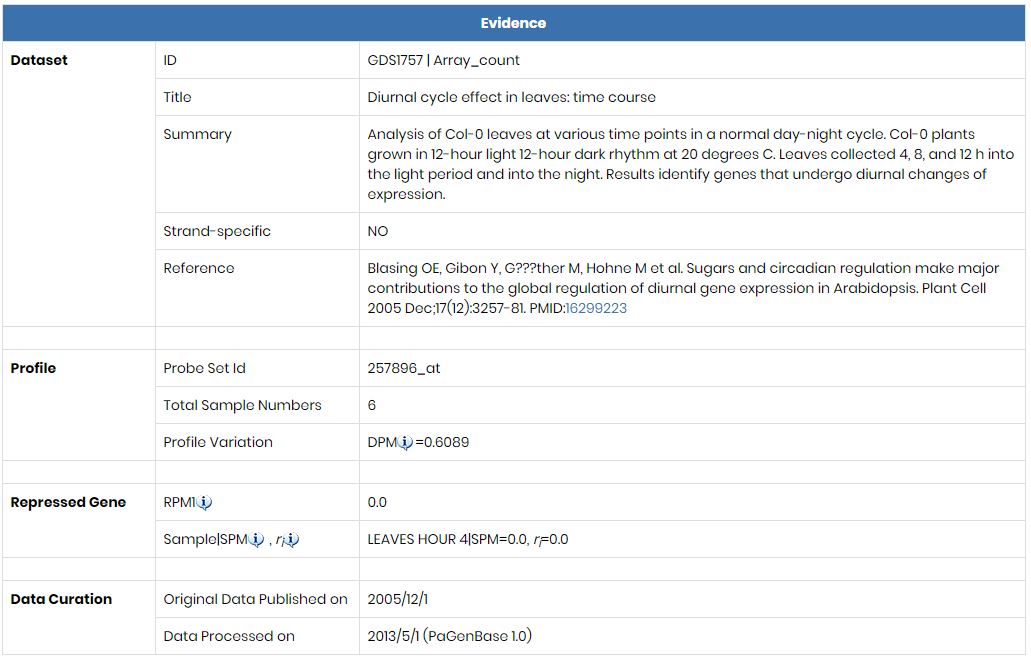
sourced dataset information
spm expression
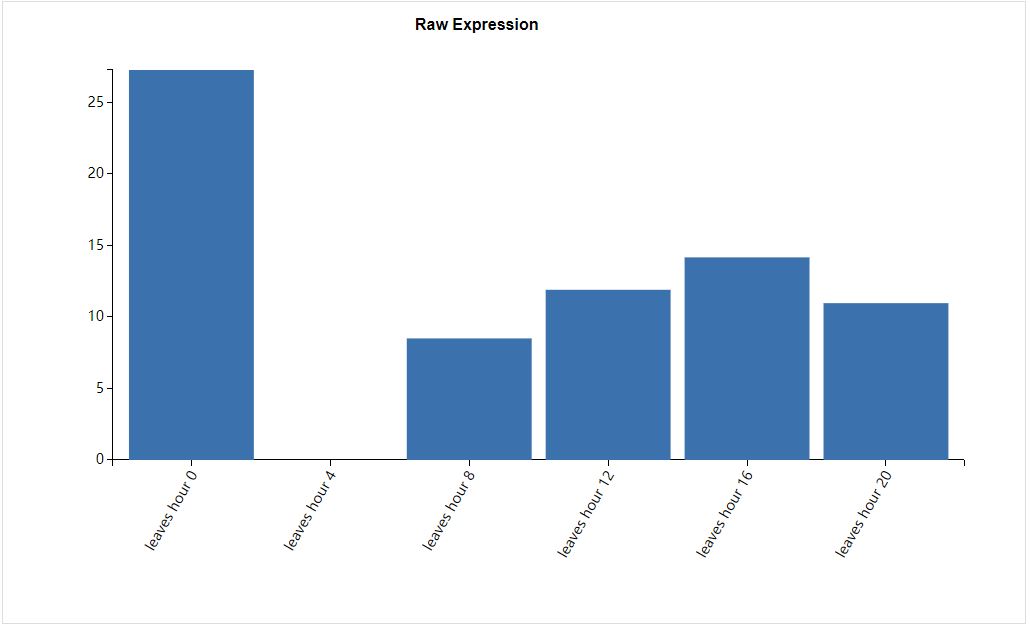
raw expression
Advanced Search
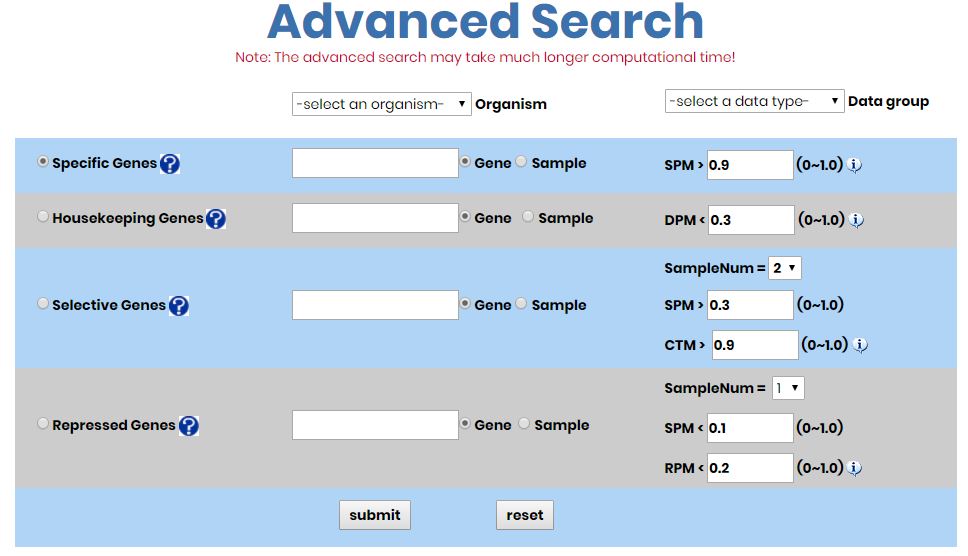
Step 1: select an organism (e.g. Homo sapiens) and data group (e.g. tissue);
Step 2: select a pattern class option (e.g. specific genes);
Step 3: select a textfield option, sample (e.g. liver) or gene (CYP3A4), and input a keyword (please refer to the STATISTICS page for sample lists);
Step 4: set proper parameters for selected pattern genes (please refer to the HELP page for tips);
Step 5: click the submit button to initiate search.
Statistics

Users can expand the sample tree to view the sample list involved in PaGenBase.
Download

The pattern gene files are downloadable by datasets.