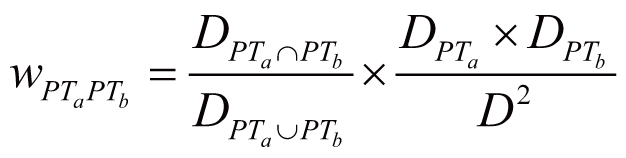
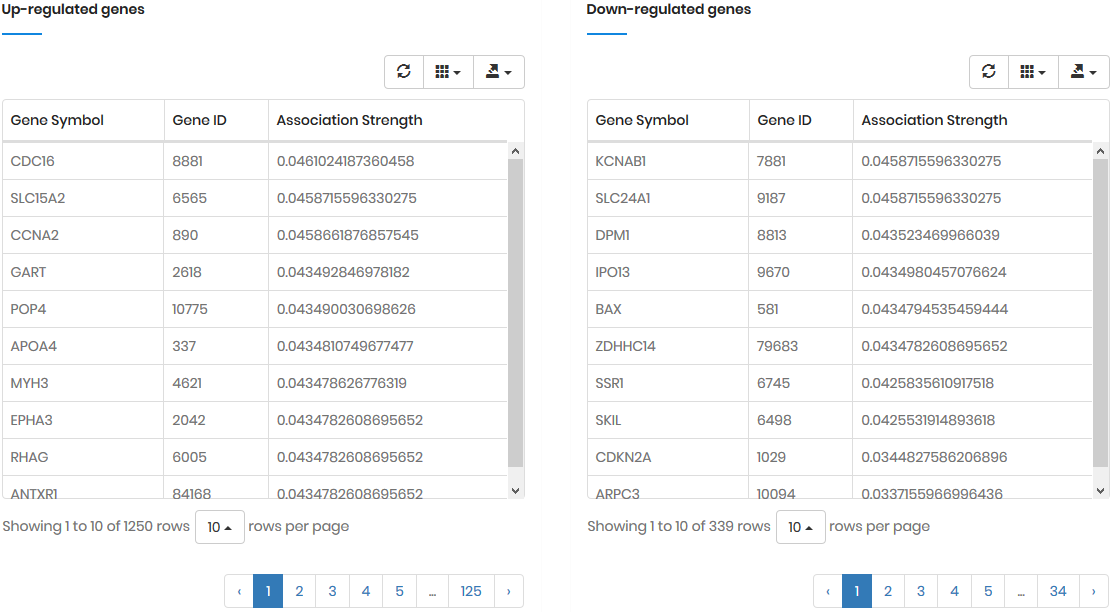
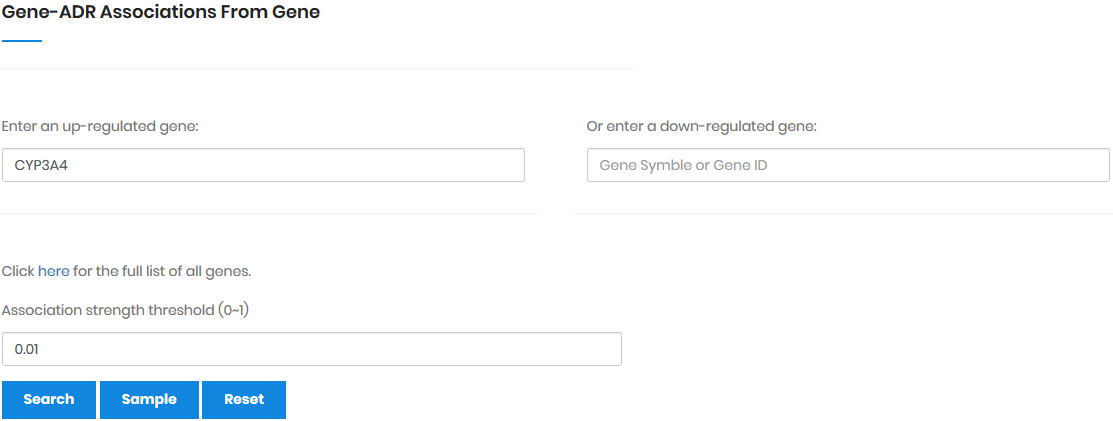
The weighted model triggered by
single gene
In the naïve Bayesian model, the three elements were denoted
as followings: the drug set D = {D1,
D2, ..., Dl}, the gene set
G = {G1, G2, ..., Gn},
and the ADR set A = {A1, A2,
..., Am}. For a single gene Gn
(Gn ∈ G), the drugs that regulate Gn
(i.e., the drug-gene pair) were denoted as DGn
= {D1
, D2, ..., Dq} (DGn
∈ D). Furthermore, the drugs that regulate Gn
and thus induce ADR Am
(Am ∈ A) were denoted as DGnAm
= {D1, D2, ..., Dp}
(DGnAm ∈ DGn
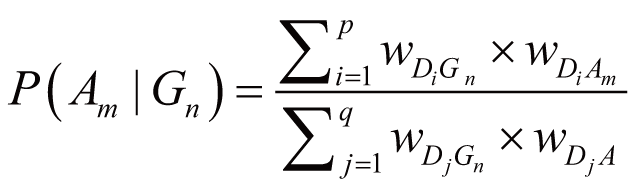
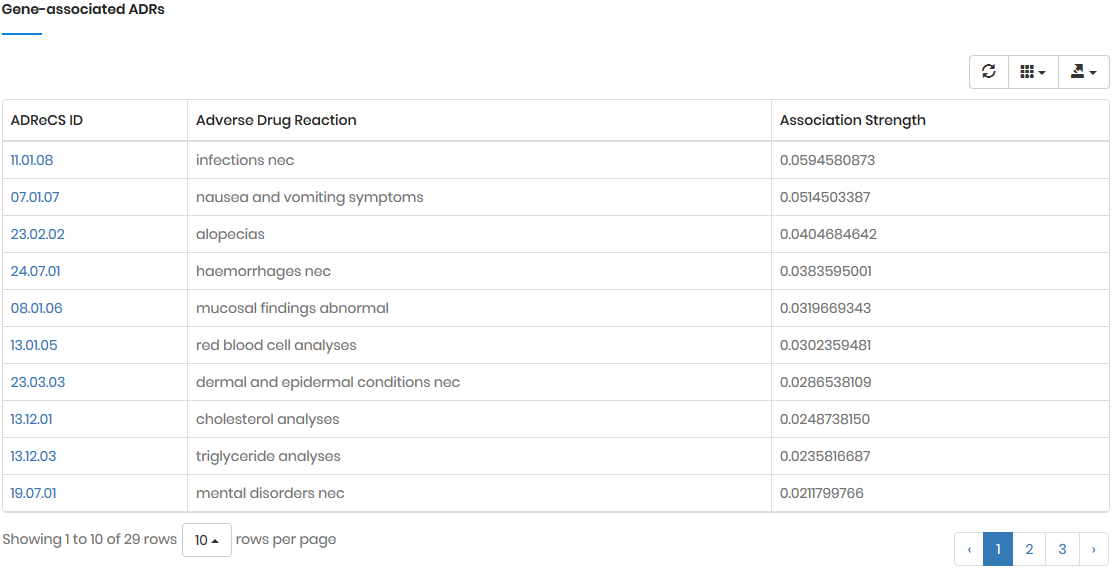
). Accordingly, the posterior probability of Am
directly triggered by Gn (despite gene-gene
regulation and ADR concurrence), denoted as P(Am
|Gn), can be calculated by:
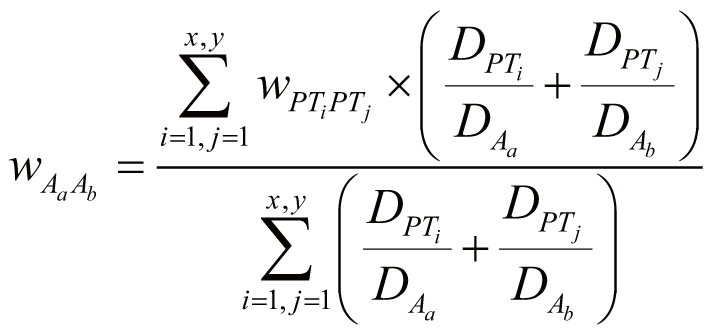
where wDiGn stands for the regulation weight
(strength) between Di (Di
∈ DGnAm) and Gn, wDiAm
stands for the association weight (i.e., ADR frequency)
between Di and Am, wDjGn
stands for the regulation strength between Dj
(Dj ∈ DGn) and Gn,
wDjA stands for the association weight
between Dj and any one of the ADRs in A.
Incorporation of gene-gene
regulation and ADR concurrence
When incorporation of gene-gene regulation and ADR concurrence
into the model, we denoted the genes that interact with Gn
as Gassoc = {G1, G2,
..., Gs} (Gassoc ⊆ G
and Gn ∈ Gassoc), and the
ADRs that have concurrence with Am as Aassoc
= {A1, A2, ..., Ar}
(Aassoc ⊆ A and Am
∈ Aassoc). Accordingly, the probability of Am
triggered by Gn, denoted as P(Am|Gn)’,
can be calculated by:
where wGnGi stands for the weight of Gn
and Gi interaction (Gi ∈ Gassoc),
wAmAj stands for the weight of Am
and Aj concurrence (Aj ∈ Aassoc),
and P(Aj|Gi) stands
for the probability of Aj directly triggered
by Gi.
The improved model triggered by
multiple genes
In most cases, a drug D regulates multiple genes; these
genes are denoted as gene set Gtgt = {G1,
G2, ..., Gt} (Gtgt
⊆ G). As the result, the probability of Am
triggered by Gtgt, denoted as P(Am|Gtgt)norm,
can be calculated by:
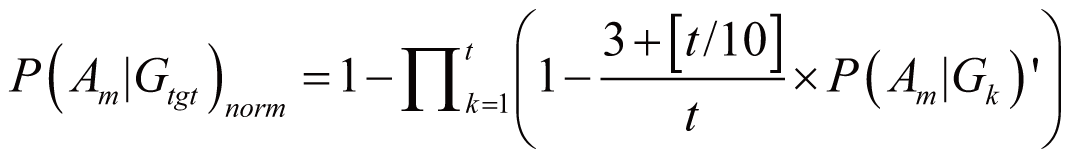
if (3
<= t < 100)
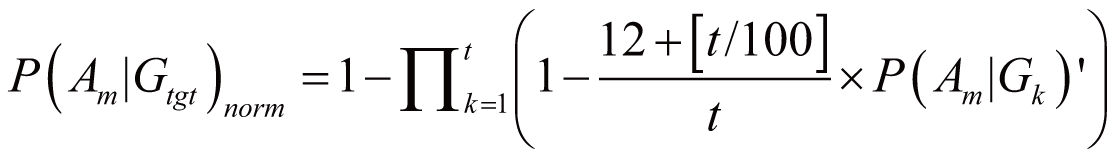
if
(100 <= t < 1000)
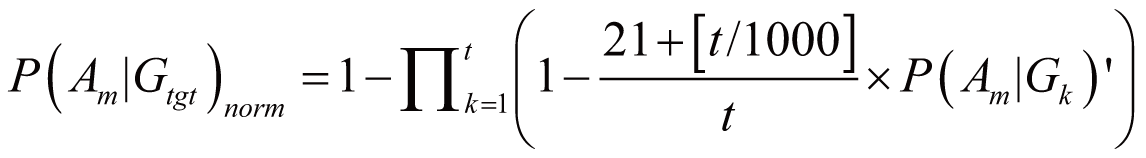
if (t
>=1000)
where P(Am|Gk)’
stands for the probability of Am triggered
by Gk; it can also serve as the occurrence
or frequency of ADR.
The methodology
Xiang, Y.P., Liu, K., Cheng, X.Y.,
Cheng, C., Gong, F., Pan, J.B. & Ji, Z.L. Rapid Assessment
of Adverse Drug Reactions by Statistical Solution of Gene
Association Network. IEEE/ACM Trans. Comput. Biol.
Bioinform. 12, 844-850 (2015).
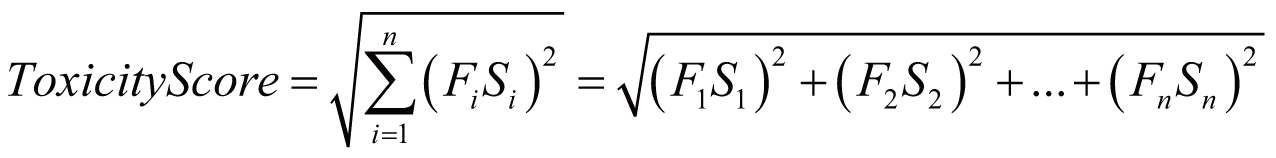
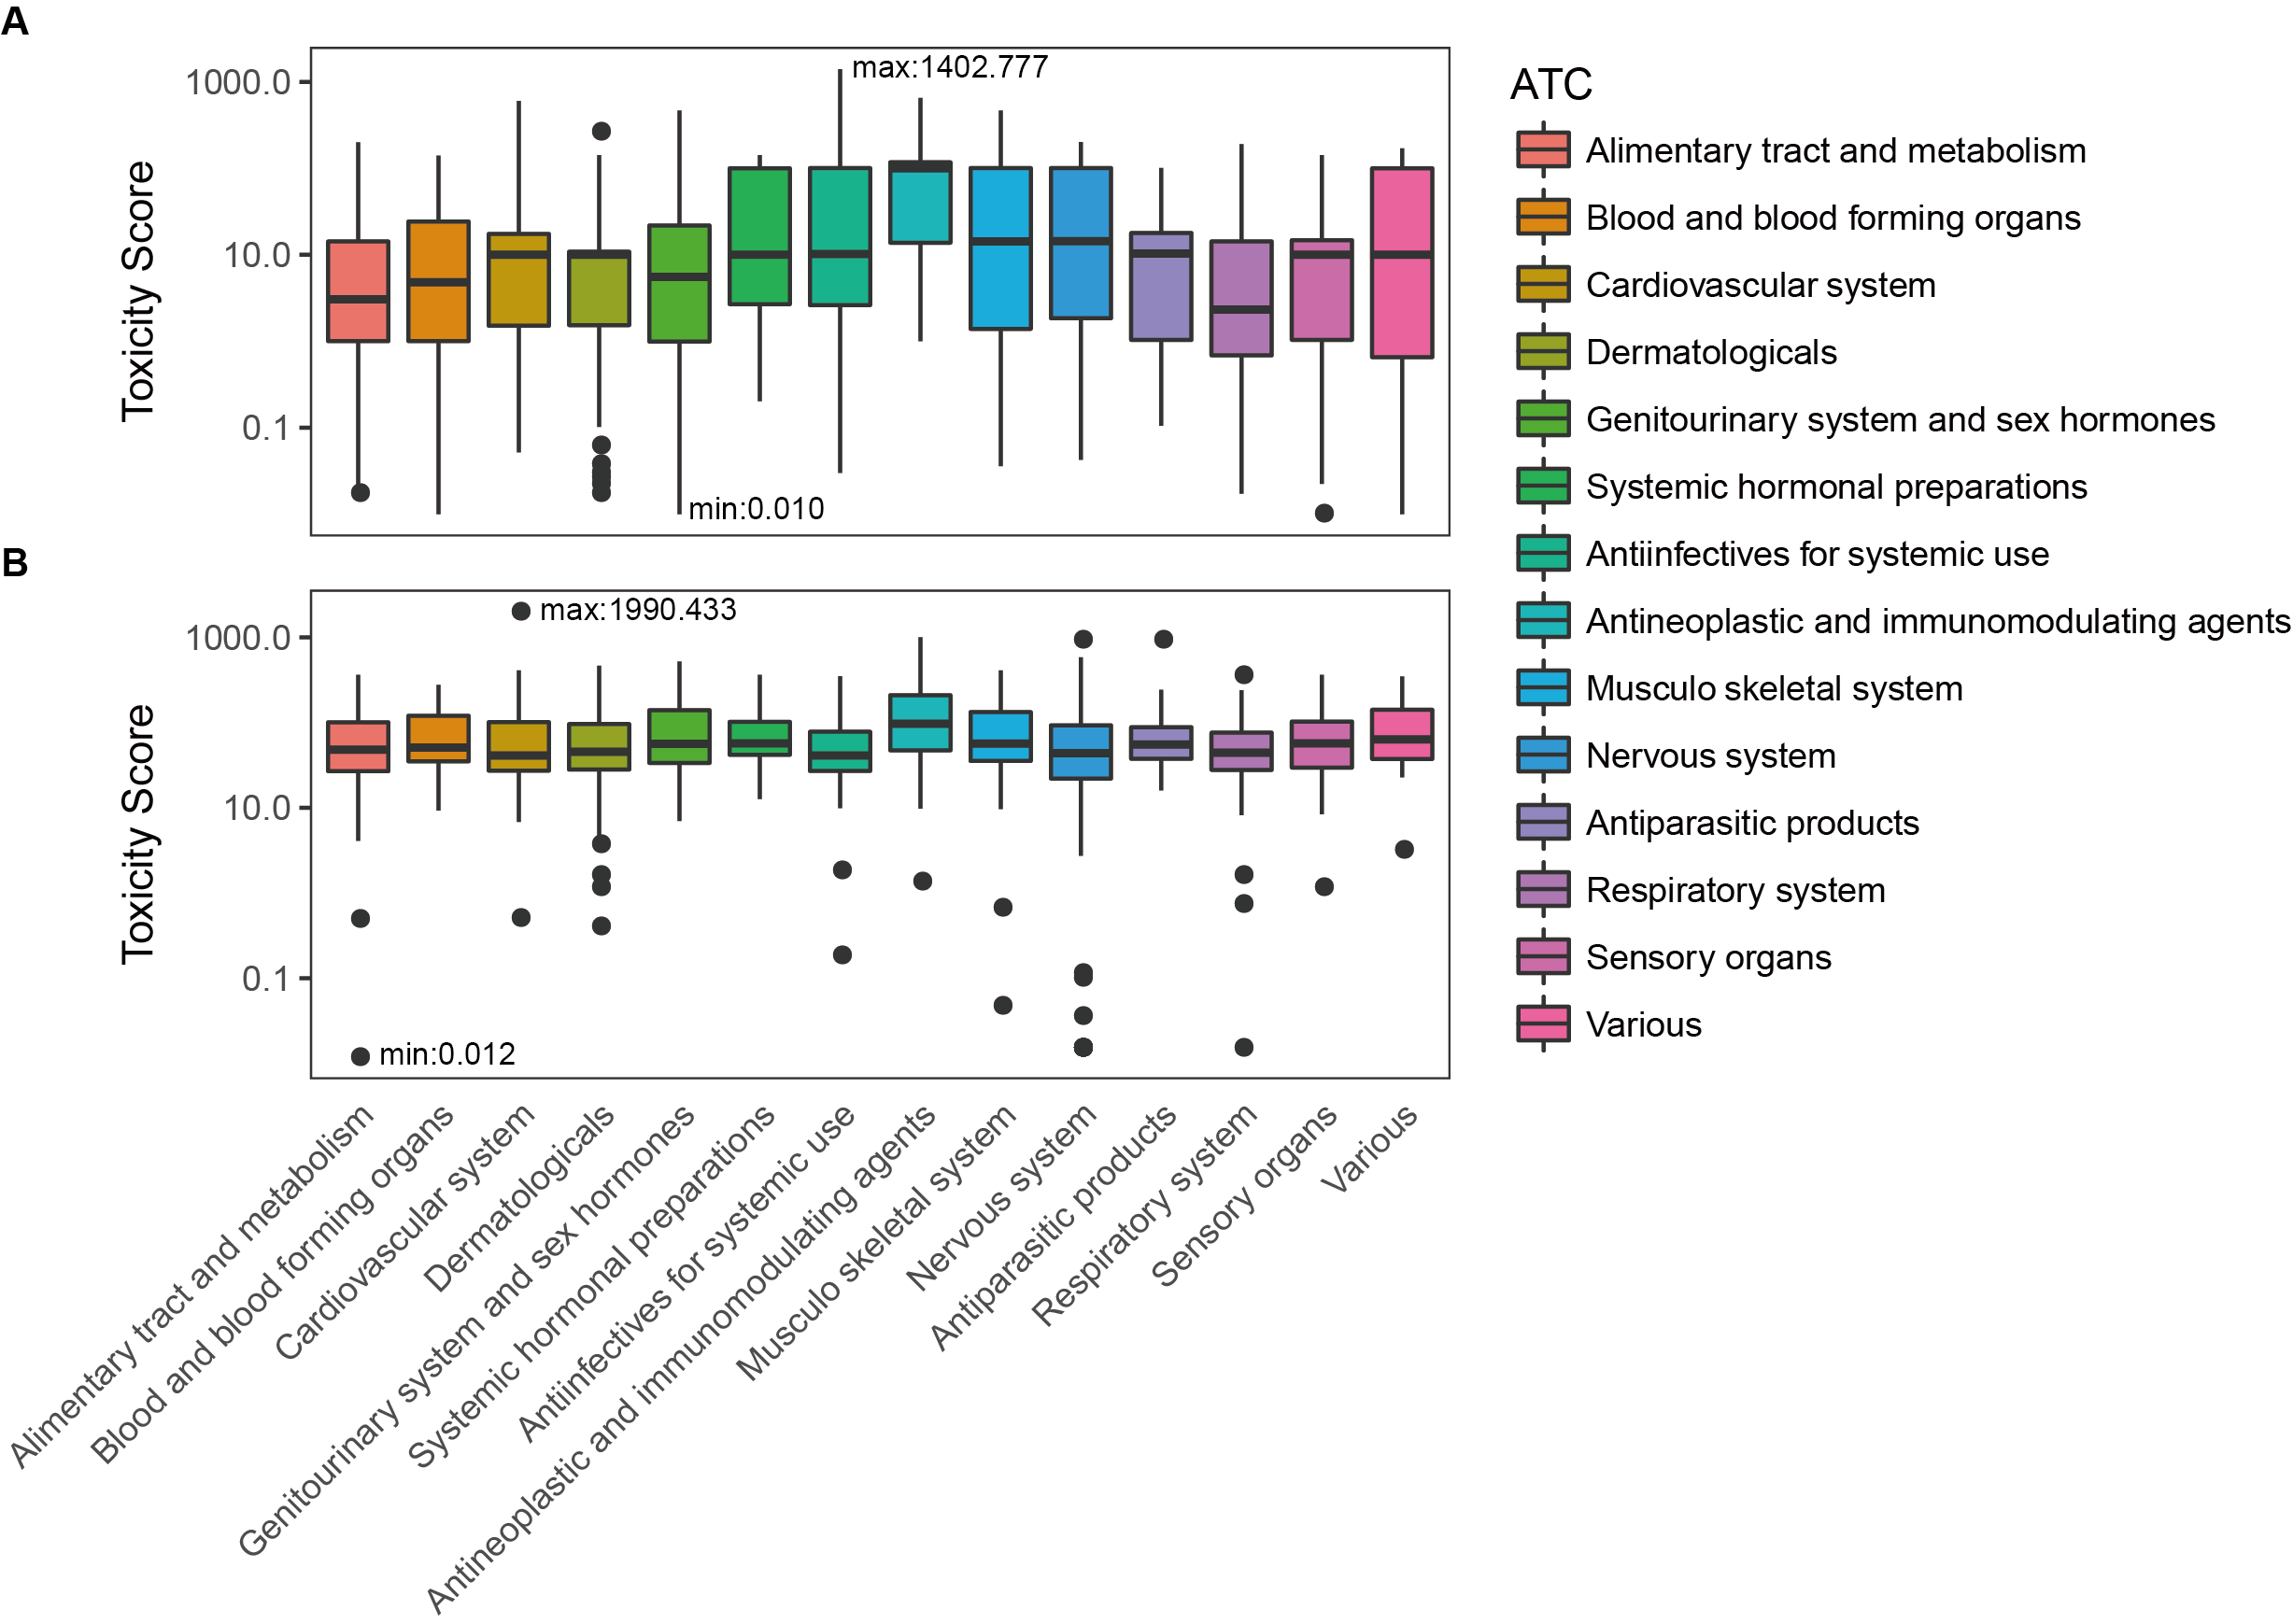
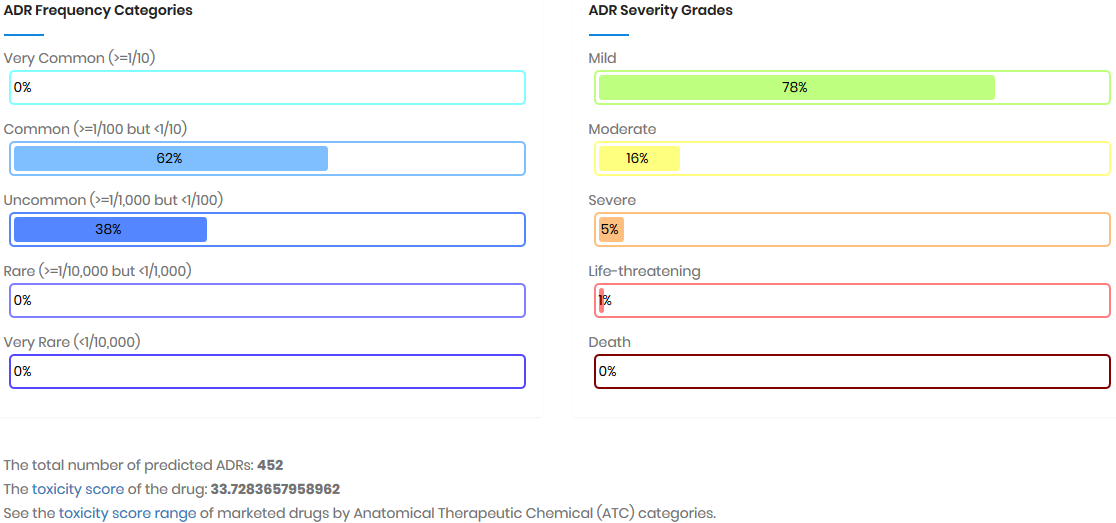
Toxicity score
The toxicity score is a
parameter designed for measuring the summarized toxicity
effects induced by a drug. It evaluates the drug safety by
integrating the information of both ADR occurrence and ADR
severity. The toxicity score of a drug can be determined by:
where Fi
stands for the estimated occurrence of ADR Ai
, Si
stands for the severity scores of ADR Ai
, and Ai
belongs to the list of ADRs {A1
, A2
, …, An
} predicted for the drug.